In the last post I showed the solution to a problem with Qt Creator Debug Helpers. Then we learned that there are some Python scripts that add the pretty print of Qt complex variables, so, that GDB can display the values in a more user-friendly way. However, Qt Creator is not the only IDE that can be used to debug Qt applications. So, how can we use these scripts in other IDEs? In this post I'll show you how to use this pretty print in Visual Studio Code.
Let's use the same application from the last post and try to debug it in Visual Studio Code. Open the Qt project folder in VS Code and follow these steps:
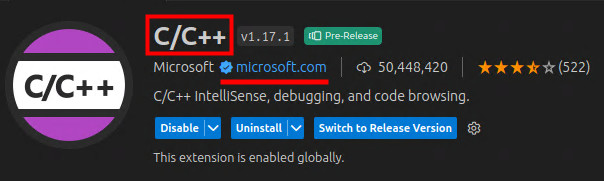
⚠️ It is necessary to have theC/C++extension installed in VS Code. To do this, open VS Code and pressCtrl Shift X. In the search bar typeC/C++and install theC/C++extension from Microsoft:
- Open
main.cpp(this will activate theC/C++extension); - Press
F1to open the command menu; - Type
C++; - select the option
C/C++: Add Debug Configuration... - select the option
(gdb) Launch. Thus thelaunch.jsonfile will be created and opened.
The important property to modify in launch.json (for now) is the program property. It must point to the application executable. Since I'm using the same Qt Creator project, I'm going to point to the folder before my ${workspaceFolder}. Then I'll point it to ${workspaceFolder}/../build-<project-name>-Qt_6_4_2_qt6-Debug/<project-name>:
{
    "configurations": [
        {
            "name": "Qt6 Debug",
            "type": "cppdbg",
            "request": "launch",
            "program": "${workspaceFolder}/../build-blogPost-Qt_6_4_2_qt6-Debug/blogPost",
            "args": [],
            "stopAtEntry": false,
            "cwd": "${fileDirname}",
            "environment": [],
            "externalConsole": false,
            "MIMode": "gdb",
            "setupCommands": [
                {
                    "description": "Enable pretty-printing for gdb",
                    "text": "-enable-pretty-printing",
                    "ignoreFailures": true
                },
                {
                    "description": "Set Disassembly Flavor to Intel",
                    "text": "-gdb-set disassembly-flavor intel",
                    "ignoreFailures": true
                }
            ]
        }
    ],
    "version": "2.0.0"
}
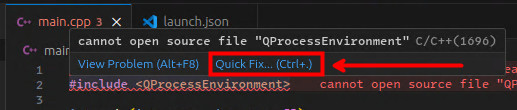
⚠️ One more tip for you. Possibly you will notice that VS Code will complain that the Qt headers were not found, in the openedmain.cpp:To resolve the headers, follow these steps:
- Move the mouse over the error;
- A popup will appear, click on
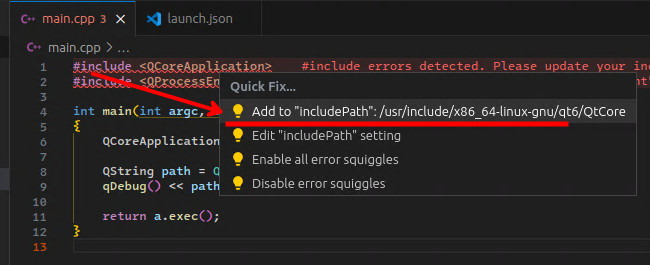
quick fix:- select the option
Add to "includePath":/usr/include/x86_64-linux-gnu/qt6/QtCore:- This will open a new tab in the editor titled
C/C++ Configurations. In this tab look for theincludePathsection. You will notice that there are two lines in the text box:${workspaceFolder}/** /usr/include/x86_64-linux-gnu/qt6/QtCore
- Change the second line to:
${workspaceFolder}/**
/usr/include/**
- After edit the text box, click outside it to save the changes;
This way we will include all system headers in the project
includePath, including Qt's. Now VS Code will no longer complain about Qt headers and will also give you theIntelliSensefor Qt types.
Now, let's try to debug the application. Put a breakpoint inside main() and press F5. Since we only have one entry in our .vscode/launch.json, it will be selected automatically.
You may notice that much like the Qt Creator issue from previous article, VS Code is also unable to display the values of complex Qt variables.
The solution is very similar to that of Qt Creator. We need to add Python scripts to GDB, so it can print Qt complex variables values instead pointers. Unfortunately we can't just reuse Qt Creator's Debug Helpers. That's because VS Code doesn't inject Python scripts into GDB the same way Qt Creator does. But, to our delight, there is the KDE community, which uses Qt in its graphical interface, and has already solved this problem for its IDE, KDevelop. So, let's reuse KDevelop's Python scripts for VS Code.
First let's download the Python scripts from the KDevelop project:
cd $HOME
mkdir .qtpp
cd .qtpp
wget https://raw.githubusercontent.com/KDE/kdevelop/master/plugins/gdb/printers/helper.py
wget https://raw.githubusercontent.com/KDE/kdevelop/master/plugins/gdb/printers/qt.py
Now we have to configure GDB to load these scripts. To do this, let's create a .gdbinit file in our user $HOME. This file will be loaded by GDB whenever it is started and will load the Python scripts needed to pretty print Qt complex variables.
cd ~
touch .gdbinit
Edit the .gdbinit with the following content:
python
import sys, os.path
sys.path.insert(0, os.path.expanduser("~/.qtpp"))
from qt import register_qt_printers
register_qt_printers (None)
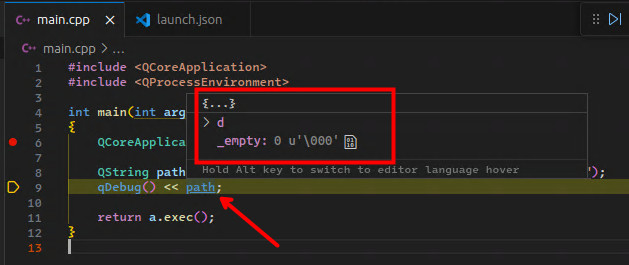
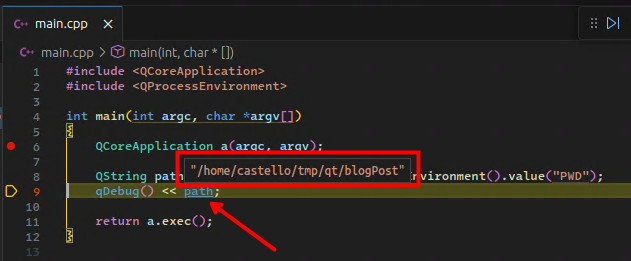
endNow let's test if GDB is loading the Python scripts correctly. Returning to VS Code, with our Qt application open, we press F5 to start a new debugging session. GDB will stop at the breakpoint we set in main(). Now let's test that pretty print is working. Mouse over the variable and see if VS Code can display its value:
For projects where you need to perform remote debug sessions, very common for embedded systems applications, this pretty printer configuration must be in the .gdbinit of the target device.
Toradex has a VS Code Extension which facilitates remote debugging of embedded Qt applications. The Qt template already configures the remote environment automatically, using containers.
You can create the project via the extension template wizard, select the target device architecture and press F5 to start the remote debug session. The extension will take care of cross-compile, deploy, configure, run the application and connect to the debugger running on the target device.
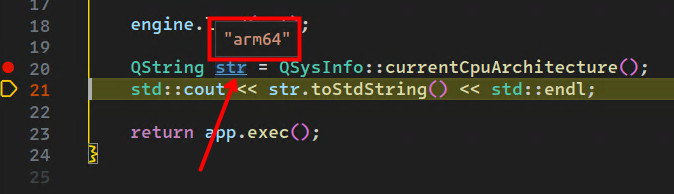
To show that we are indeed running on the target device, I added the follow lines to our main.cpp:
QString str = QSysInfo::currentCpuArchitecture();
std::cout << str.toStdString() << std::endl;
So, I can run the remote debug, stop the application at the breakpoint and check the value of the QString str variable in VS Code:
You may notice that the variable value will be displayed correctly, pretty printer is already automatically configured by the extension on the target device, we don't need to worry.
⚠️ To perform remote deploy/debug using the Toradex extension, you need to have a target device running TorizonCore OS
⚠️ You can also run TorizonCore on non-Toradex hardware. For that, you can use the Common Torizon
In this post I showed how to use Qt's pretty print in Visual Studio Code. For this, we reuse the Python scripts from KDevelop. I also showed that for remote debugging we have to configure .gdbinit in the remote environment, and for that we have the Torizon VS Code Extension that already configures pretty print for remote deploy/debug automatically.
If for some reason you prefer using VS Code over Qt Creator to work, now you know how to use pretty print of Qt complex variables in VS Code.
Was this post helpful to you? Let me know, contact me, follow me on social media: